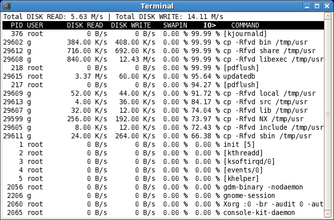
 A while back, I linkblogged about “iotop”, a
very useful top-like UNIX utility to show which processes are initiating the
most I/O bandwidth.
Teodor Milkov left a comment which is well worth noting, though:
Definitely iotop is a step in the right direction.
Unfortunately it’s still hard to tell who’s wasting most disk IO in too many situations.
Suppose you have two processes – dd and mysqld.
dd is doing massive linear IO and its throughput is 10MB/s. Let’s say dd reads from a slow USB drive and it’s limited to 10MB/s because of the slow reads from the USB.
At the same time MySQL is doing a lot of very small but random IO. A modern SATA 7200 rpm disk drive is only capable of about 90 IO operations per second (IOPS).
So ultimately most of the disk time would be occupied by the mysqld. Still iotop would show dd as the bigger IO user.
He goes into more detail on his blog. Fundamentally, iotop works based on what the Linux kernel offers for per-process I/O accounting, which is I/O bandwidth per second, not I/O operations per second. Most contemporary storage in desktops and low-end server equipment is IOPS-bound (‘A modern 7200 rpm SATA drive is only capable of about 90 IOPS’). Good point! Here’s hoping a future change to the Linux per-process I/O API allows measurement of IOPS as well…