So I was chatting to Danny O’Brien a few days ago. He noted that he’d reduced his Spamassassin “this is spam” threshold from the default 5.0 points to 3.7, and was wondering what that meant:
I know what it means in raw technical terms — spamassassin now marks anything >3.7 as spam, as opposed to the default of five. But given the genetic algorithm way that SA calculates the rule scoring, what does lowering the score mean? That I’m more confident that stuff marked ham is stuffed marked ham than the average person? That my bayesian scoring is now really good?
Do people usually do this without harmful side-effects? What does it mean about them if they do it?
Does it make me a good person? Will I smell of ham? These are the things that keep me awake at night.
It’s a good question! Here’s what I responded with — it occurs to me that this is probably quite widely speculated about, so let’s blog it here, too.
As you tweak the threshold, it gets more or less aggressive.
By default, we target a false positive rate of less than 0.1% — that means 1 FP, a ham marked as spam incorrectly, per 1000 ham messages. Last time the scores were generated, we ran our usual accuracy estimation tests, and got a false positive rate of 0.06% (1 in 1667 hams) and a false negative rate of 1.49% (1 in 67 spams) for the default threshold of 5.0 points. That’s assuming you’re using network tests (you should be) and have Bayes training (this is generally the case after running for a few weeks with autolearning on).
If you lower the threshold, then, that trades off the false negatives (reducing them — less spam getting past) in exchange for more false positives (hams getting caught). In those tests, here’s some figures for other thresholds:
SUMMARY for threshold 3.0: False positives: 290 0.43% False negatives: 313 0.26%
SUMMARY for threshold 4.0: False positives: 104 0.15% False negatives: 1084 0.91%
SUMMARY for threshold 4.5: False positives: 68 0.10% False negatives: 1345 1.13%
so you can see FPs rise quite quickly as the threshold drops. At 4.0 points, the nearest to 3.7, 1 in 666 ham messages (0.15%) will be marked incorrectly as spam. That’s nearly 3 times as many FPs as the default setting’s value (0.06%). On the other hand, only 1 in 109 spams will be mis-filed.
Here’s the reports from the last release, with all those figures for different thresholds — should be useful for figuring out the likelihoods!
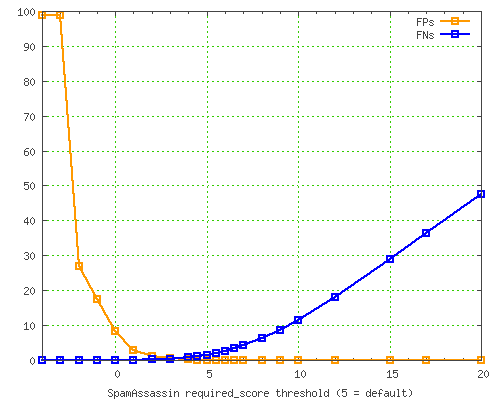
In fact, let’s get some graphs from that report. Here is a graph of false positives (in orange) vs false negatives (in blue) as the threshold changes…
and, to illustrate the details a little better, zoom in to the area between 0% and 1%…
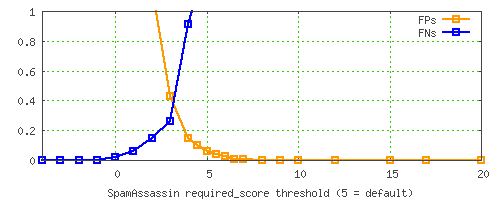
You can see that the default threshold of 5.0 isn’t where the FP% and FN% rates meet; instead, it’s got a much lower FP% rate than FN%. This is because we consider FPs to be much more dangerous than missed spams, so we try to avoid them to a higher degree.
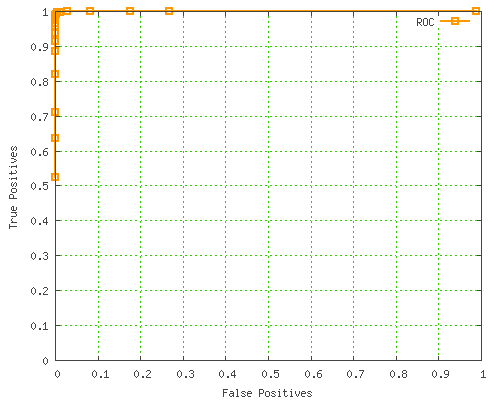
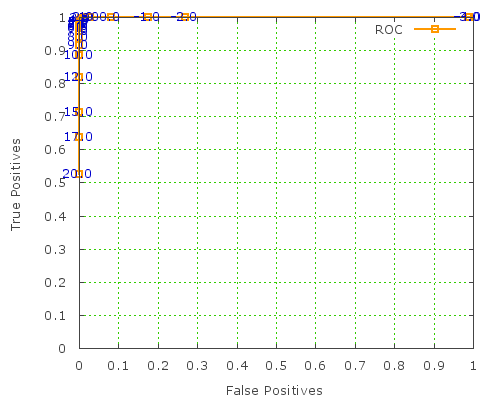
An alternative, more standardized way to display this info is as a Receiver Operating Characteristic curve, which is basically a plot of the true positive rate vs false positives, on a scale from 0 to 1.
Here’s the SpamAssassin ROC curve:
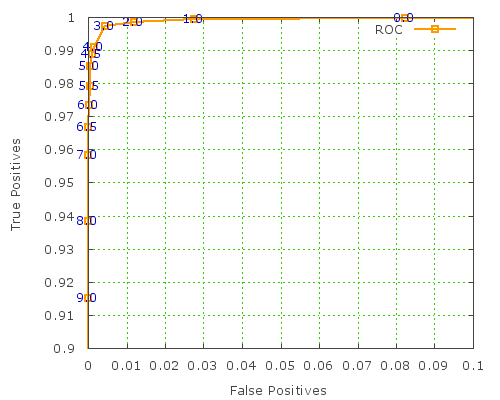
More usefully, here’s the ROC curve zoomed in nearer the “perfect accuracy” top-left corner:
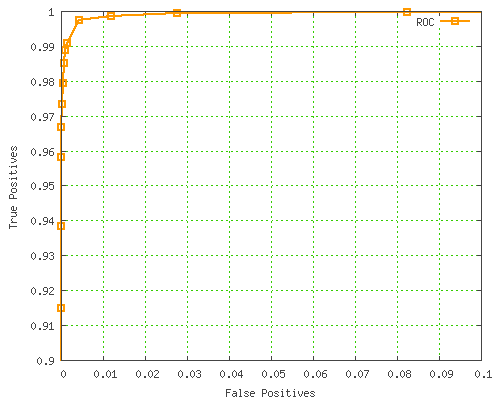
Unfortunately, this type of graph isn’t much use for picking a SpamAssassin threshold. GNUplot doesn’t allow individual points to be marked with the value from a certain column, otherwise this would be much more useful, since we’d be able to tell which threshold value corresponds to each point. C’est la vie!
Update:: this is possible with GNUplot 4.2 onwards, it seems. great news! Hat tip to Philipp K Janert for the advice. here are updated graphs using this feature:
(GNUplot commands to render these graphs are here.)
Update again: much better interactive Flash graphs here.